 Web Server Statistics for cvps.org Web Server Statistics for cvps.org
(Go To: Top: General Summary: Daily Summary: Hourly Summary: Domain Report: Organization Report: Operating System Report: Status Code Report: File Size Report: File Type Report: Directory Report: Request Report)
This report contains overall statistics.
Successful requests: 209,852
Average successful requests per day: 209,851
Successful requests for pages: 39,379
Average successful requests for pages per day: 39,378
Failed requests: 1,133
Redirected requests: 26
Distinct files requested: 172,228
Distinct hosts served: 1,429
Corrupt logfile lines: 68
Data transferred: 18.17 gigabytes
Average data transferred per day: 18.17 gigabytes
(Go To: Top: General Summary: Daily Summary: Hourly Summary: Domain Report: Organization Report: Operating System Report: Status Code Report: File Size Report: File Type Report: Directory Report: Request Report)
This report lists the total activity for each day of the week, summed over all the weeks in the report.
Each unit ( ) represents 1,000
requests for pages or part thereof.
) represents 1,000
requests for pages or part thereof.
day: #reqs: #pages: ---: ------: ------: Sun: 0: 0: Mon: 0: 0: Tue: 0: 0: Wed: 0: 0: Thu: 0: 0: Fri: 209827: 39374:Sat: 25: 5:
(Go To: Top: General Summary: Daily Summary: Hourly Summary: Domain Report: Organization Report: Operating System Report: Status Code Report: File Size Report: File Type Report: Directory Report: Request Report)
This report lists the total activity for each hour of the day, summed over all the days in the report.
Each unit () represents 80 requests
for pages or part thereof.
hour: #reqs: #pages: ----: -----: ------: 0: 6021: 706:8: 8277: 1914:
14: 8643: 1891:
17: 9415: 2402:
(Go To: Top: General Summary: Daily Summary: Hourly Summary: Domain Report: Organization Report: Operating System Report: Status Code Report: File Size Report: File Type Report: Directory Report: Request Report)
This report lists the countries of the computers which requested files.
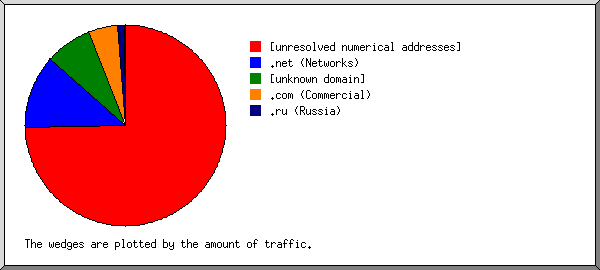
Listing domains, sorted by the amount of traffic.
 #reqs: %bytes: domain
------: ------: ------
208592: 99.72%: .com (Commercial)
  1037:  0.19%: [unresolved numerical addresses]
    12:  0.04%: .info (Informational)
    25:  0.02%: .net (Networks)
   181:  0.02%: [unknown domain]
     1:       : .tr (Turkey)
     1:       : .hu (Hungary)
     1:       : .za (South Africa)
     1:       : .om (Oman)
     1:       : .nl (Netherlands)
(Go To: Top: General Summary: Daily Summary: Hourly Summary: Domain Report: Organization Report: Operating System Report: Status Code Report: File Size Report: File Type Report: Directory Report: Request Report)
This report lists the organizations of the computers which requested files.
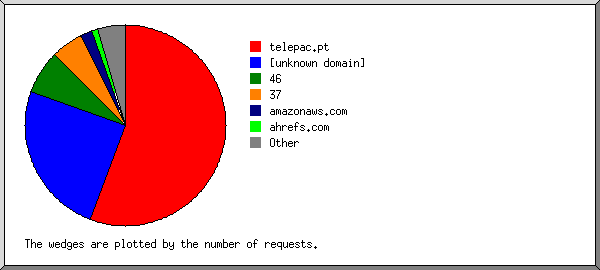
Listing the top 20 organizations by the number of requests, sorted by the number of requests.
 #reqs: %bytes: organization
------: ------: ------------
186959: 18.67%: phpwebhosting.com
 21019: 80.85%: vultrusercontent.com
   379:  0.01%: bytedance.com
   181:  0.02%: [unknown domain]
    98:  0.16%: amazonaws.com
    57:  0.01%: 167.148
    55:  0.01%: apple.com
    51:  0.01%: 137.184
    51:  0.01%: 155.117
    50:  0.01%: 143.20
    47:  0.01%: 144.31
    43:  0.01%: 207.180
    41:  0.01%: 216.75
    40:  0.01%: 143.14
    38:       : 47
    33:  0.01%: 159.223
    32:  0.01%: 157.230
    29:       : 216.244
    27:  0.01%: 128.199
    26:       : 142.93
   596:  0.20%: [not listed: 82 organizations]
(Go To: Top: General Summary: Daily Summary: Hourly Summary: Domain Report: Organization Report: Operating System Report: Status Code Report: File Size Report: File Type Report: Directory Report: Request Report)
This report lists the operating systems used by visitors.
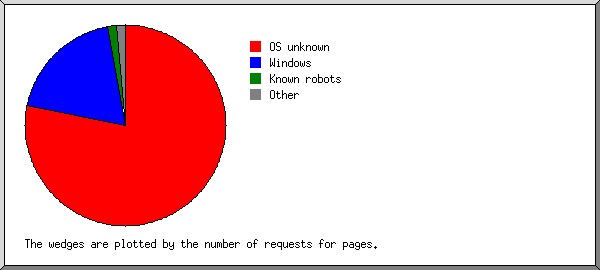
Listing operating systems, sorted by the number of requests for pages.
 #:  #reqs: #pages: OS
--: ------: ------: --
 1:  33300:  26022: Windows
  :  32260:  24990:   Windows NT
  :    988:    980:   Unknown Windows
  :     51:     51:   Windows XP
  :      1:      1:   Windows 98
 2:   8176:   5244: Known robots
 3:  16474:   4639: OS unknown
 4: 149466:   3266: Macintosh
 5:   2086:    208: Unix
  :   2050:    172:   Linux
  :     23:     23:   Other Unix
  :     13:     13:   BSD
 6:      4:      0: OS/2
(Go To: Top: General Summary: Daily Summary: Hourly Summary: Domain Report: Organization Report: Operating System Report: Status Code Report: File Size Report: File Type Report: Directory Report: Request Report)
This report lists the HTTP status codes of all requests.

Listing status codes, sorted numerically.
 #reqs: status code
------: -----------
209476: 200 OK
   280: 206 Partial content
    26: 301 Document moved permanently
    96: 304 Not modified since last retrieval
     3: 403 Access forbidden
  1118: 404 Document not found
    12: 405 Method not allowed
(Go To: Top: General Summary: Daily Summary: Hourly Summary: Domain Report: Organization Report: Operating System Report: Status Code Report: File Size Report: File Type Report: Directory Report: Request Report)
This report lists the sizes of files.
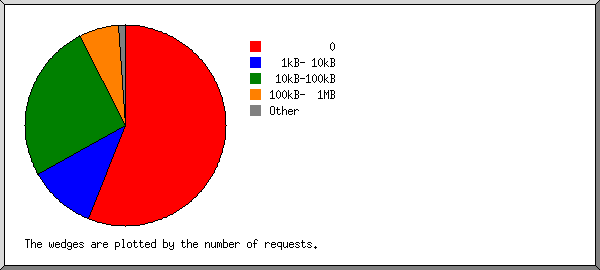
       size:  #reqs: %bytes:
-----------: ------: ------:
          0:     96:       :
   1B-  10B:      0:       :
  11B- 100B:    266:       :
 101B-  1kB:  14948:  0.06%:
  1kB- 10kB:   8926:  0.31%:
 10kB-100kB: 162623: 11.51%:
100kB-  1MB:  22958: 87.58%:
  1MB- 10MB:     33:  0.29%:
 10MB-100MB:      2:  0.25%:
(Go To: Top: General Summary: Daily Summary: Hourly Summary: Domain Report: Organization Report: Operating System Report: Status Code Report: File Size Report: File Type Report: Directory Report: Request Report)
This report lists the extensions of files.
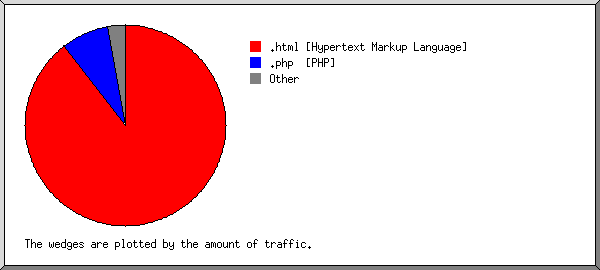
Listing extensions with at least 0.1% of the traffic, sorted by the amount of traffic.
 #reqs: %bytes: extension
------: ------: ---------
 22687: 87.26%: .html [Hypertext Markup Language]
156775: 10.42%: .php  [PHP]
 13089:  1.69%: .jpg  [JPEG graphics]
    96:  0.24%: .pdf  [Adobe Portable Document Format]
     1:  0.15%: .mp4
 17204:  0.25%: [not listed: 13 extensions]
(Go To: Top: General Summary: Daily Summary: Hourly Summary: Domain Report: Organization Report: Operating System Report: Status Code Report: File Size Report: File Type Report: Directory Report: Request Report)
This report lists the directories from which files were requested. (The figures for each directory include all of its subdirectories.)
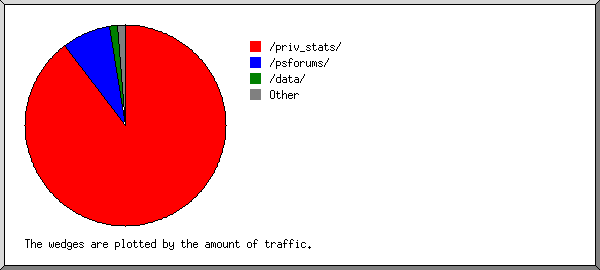
Listing directories with at least 0.01% of the traffic, sorted by the amount of traffic.
 #reqs: %bytes: directory
------: ------: ---------
 22740: 87.26%: /priv_stats/
157068: 10.43%: /psforums/
 28768:  1.60%: /gallery/
   304:  0.35%: /data/
    47:  0.19%: /Photos/
     6:  0.15%: /video/
   898:  0.01%: [root directory]
    21:  0.01%: [not listed: 4 directories]
(Go To: Top: General Summary: Daily Summary: Hourly Summary: Domain Report: Organization Report: Operating System Report: Status Code Report: File Size Report: File Type Report: Directory Report: Request Report)
This report lists the files on the site.
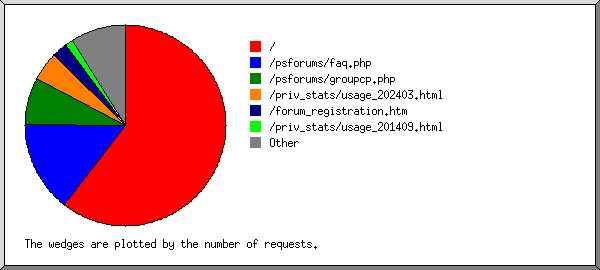
Listing files with at least 20 requests, sorted by the number of requests.
#reqs: %bytes:          last time: file
-----: ------: ------------------: ----
45171:  2.95%: Jul/11/26 12:00 AM: /psforums/privmsg.php
21020: 80.86%: Jul/11/26 12:00 AM: /priv_stats/usage_202605.html
12634:  0.88%: Jul/11/26 12:00 AM: /psforums/login.php/memberlist.php
10173:  0.66%: Jul/11/26 12:00 AM: /psforums/index.php
10031:  0.65%: Jul/11/26 12:00 AM: /psforums/faq.php
 9972:  0.65%: Jul/11/26 12:00 AM: /psforums/memberlist.php
 9965:  0.65%: Jul/11/26 12:00 AM: /psforums/groupcp.php
 9911:  0.69%: Jul/11/26 12:00 AM: /psforums/login.php
 9709:  0.63%: Jul/10/26 11:59 PM: /psforums/search.php
 4634:  0.32%: Jul/11/26 12:00 AM: /psforums/login.php/groupcp.php
 3609:  0.23%: Jul/11/26 12:00 AM: /psforums/faq.php/profile.php
 3482:  0.24%: Jul/11/26 12:00 AM: /psforums/login.php/search.php
 3005:  0.21%: Jul/10/26 11:59 PM: /psforums/login.php/index.php
 2925:  0.20%: Jul/10/26 11:59 PM: /psforums/login.php/login.php
 2891:  0.20%: Jul/10/26 11:58 PM: /psforums/login.php/faq.php
 2639:  0.17%: Jul/10/26 11:59 PM: /psforums/profile.php
 1885:  0.12%: Jul/11/26 12:00 AM: /psforums/faq.php/faq.php
 1861:  0.12%: Jul/10/26 11:59 PM: /psforums/faq.php/groupcp.php
 1633:  0.10%: Jul/11/26 12:00 AM: /psforums/faq.php/index.php
 1511:  0.10%: Jul/10/26 11:59 PM: /psforums/faq.php/privmsg.php
  797:  3.27%: Jul/10/26 11:57 PM: /priv_stats/usage_202604.html
  412:       : Jul/10/26 11:36 PM: /forum_registration.htm
  390:  0.03%: Jul/10/26 11:59 PM: /psforums/login.php/faq.php/faq.php
  265:       : Jul/10/26 11:59 PM: /robots.txt
  207:  0.01%: Jul/10/26 11:59 PM: /psforums/login.php/login.php/login.php/profile.php
   75:  0.01%: Jul/10/26 11:59 PM:   /psforums/login.php/login.php/login.php/profile.php?mode=editprofile
   69:       : Jul/10/26 11:52 PM:   /psforums/login.php/login.php/login.php/profile.php?mode=register
   59:       : Jul/10/26 11:59 PM:   /psforums/login.php/login.php/login.php/profile.php?mode=sendpassword
  167:  0.01%: Jul/10/26 11:58 PM: /psforums/login.php/login.php/profile.php
   60:       : Jul/10/26 11:57 PM:   /psforums/login.php/login.php/profile.php?mode=sendpassword
   54:       : Jul/10/26 11:58 PM:   /psforums/login.php/login.php/profile.php?mode=editprofile
   52:       : Jul/10/26 11:58 PM:   /psforums/login.php/login.php/profile.php?mode=register
  139:  0.01%: Jul/10/26 11:43 PM: /psforums/search.php/groupcp.php
  118:       : Jul/10/26 11:38 PM: /
  107:  0.39%: Jul/10/26 11:58 PM: /priv_stats/usage_202607.html
   94:  0.01%: Jul/10/26 11:52 PM: /psforums/search.php/search.php
   90:  0.01%: Jul/10/26 11:41 PM: /psforums/search.php/login.php
   85:  0.33%: Jul/10/26  4:17 PM: /priv_stats/usage_202606.html
   83:  0.01%: Jul/10/26 11:53 PM: /psforums/search.php/index.php
   83:  0.01%: Jul/10/26 11:48 PM: /psforums/login.php/login.php/faq.php/groupcp.php/profile.php
   80:  0.01%: Jul/10/26 11:59 PM: /psforums/login.php/login.php/login.php/login.php
   77:  0.01%: Jul/10/26 11:57 PM: /psforums/login.php/memberlist.php/privmsg.php
   76:  0.01%: Jul/10/26 11:57 PM:   /psforums/login.php/memberlist.php/privmsg.php?folder=inbox
   76:  0.01%: Jul/10/26 11:44 PM: /psforums/login.php/faq.php/profile.php
   74:  0.01%: Jul/10/26 11:53 PM: /psforums/login.php/login.php/login.php/faq.php
   70:       : Jul/10/26 10:22 PM: /psforums/login.php/login.php/faq.php/login.php/groupcp.php/memberlist.php/memberlist.php/profile.php
   27:       : Jul/10/26 10:21 PM:   /psforums/login.php/login.php/faq.php/login.php/groupcp.php/memberlist.php/memberlist.php/profile.php?mode=sendpassword
   23:       : Jul/10/26 10:22 PM:   /psforums/login.php/login.php/faq.php/login.php/groupcp.php/memberlist.php/memberlist.php/profile.php?mode=editprofile
   20:       : Jul/10/26 10:22 PM:   /psforums/login.php/login.php/faq.php/login.php/groupcp.php/memberlist.php/memberlist.php/profile.php?mode=register
   70:       : Jul/10/26 11:49 PM: /psforums/login.php/login.php/login.php/privmsg.php
   70:       : Jul/10/26 11:49 PM:   /psforums/login.php/login.php/login.php/privmsg.php?folder=inbox
   66:       : Jul/10/26 11:49 PM: /psforums/search.php/faq.php
   65:       : Jul/10/26 11:59 PM: /psforums/login.php/login.php/login.php/memberlist.php
   63:       : Jul/10/26 11:59 PM: /psforums/login.php/login.php/login.php/index.php
   59:       : Jul/10/26 11:58 PM: /psforums/login.php/login.php/memberlist.php
   58:       : Jul/10/26 11:53 PM: /psforums/login.php/login.php/login.php/groupcp.php
   54:       : Jul/10/26 10:58 PM: /psforums/login.php/login.php/faq.php/login.php/groupcp.php/profile.php
   50:       : Jul/10/26 11:50 PM: /psforums/search.php/login.php/groupcp.php/profile.php
   50:       : Jul/10/26 11:56 PM: /psforums/login.php/profile.php
   48:       : Jul/10/26 11:42 PM: /psforums/login.php/login.php/privmsg.php
   45:       : Jul/10/26 11:42 PM:   /psforums/login.php/login.php/privmsg.php?folder=inbox
   48:       : Jul/10/26 11:43 PM: /psforums/memberlist.php/login.php
   47:       : Jul/10/26 11:03 PM: /psforums/search.php/faq.php/groupcp.php/profile.php
   46:       : Jul/10/26 11:54 PM: /psforums/login.php/login.php/index.php
   46:       : Jul/10/26 11:28 PM: /psforums/search.php/search.php/search.php/profile.php
   45:       : Jul/10/26 11:54 PM: /psforums/login.php/login.php/login.php
   45:       : Jul/10/26 11:41 PM: /psforums/profile.php/groupcp.php
   44:       : Jul/10/26 11:41 PM: /psforums/search.php/faq.php/profile.php
   43:       : Jul/10/26 11:34 PM: /psforums/search.php/faq.php/faq.php
   42:       : Jul/10/26 10:11 PM: /psforums/faq.php/memberlist.php
   41:       : Jul/10/26 11:28 PM: /psforums/search.php/faq.php/groupcp.php/memberlist.php
   41:       : Jul/10/26 11:32 PM: /psforums/search.php/faq.php/groupcp.php/faq.php
   40:       : Jul/10/26 11:59 PM: /psforums/login.php/login.php/faq.php/memberlist.php/profile.php
   40:       : Jul/10/26 11:53 PM: /psforums/profile.php/faq.php
   39:       : Jul/10/26 11:02 PM: /psforums/profile.php/login.php
   39:  0.14%: Jul/10/26 11:05 PM: /priv_stats/usage_202408.html
   39:       : Jul/10/26 10:54 PM: /psforums/search.php/memberlist.php/profile.php
   38:       : Jul/10/26 10:42 PM: /psforums/search.php/memberlist.php/faq.php/profile.php
   37:       : Jul/10/26 11:59 PM: /psforums/memberlist.php/index.php
   36:       : Jul/10/26 11:57 PM: /psforums/login.php/faq.php/privmsg.php
   18:       : Jul/10/26 10:29 PM:   /psforums/login.php/faq.php/privmsg.php?folder=inbox
   36:       : Jul/10/26 11:35 PM: /psforums/search.php/memberlist.php/login.php/profile.php
   35:       : Jul/10/26 11:04 PM: /psforums/profile.php/index.php
   33:       : Jul/10/26 11:48 PM: /psforums/search.php/memberlist.php/faq.php/login.php
   33:       : Jul/10/26 11:03 PM: /psforums/login.php/login.php/faq.php/search.php/profile.php
   33:       : Jul/10/26 10:19 PM: /psforums/login.php/login.php/groupcp.php
   32:       : Jul/10/26 11:31 PM: /psforums/login.php/faq.php/index.php
   32:       : Jul/10/26 11:28 PM: /psforums/login.php/login.php/faq.php/login.php/profile.php
   31:       : Jul/10/26 11:46 PM: /psforums/search.php/faq.php/groupcp.php/groupcp.php
   30:       : Jul/10/26 11:55 PM: /psforums/login.php/login.php/groupcp.php/faq.php/faq.php/groupcp.php/profile.php
   13:       : Jul/10/26 11:55 PM:   /psforums/login.php/login.php/groupcp.php/faq.php/faq.php/groupcp.php/profile.php?mode=editprofile
   10:       : Jul/10/26 11:55 PM:   /psforums/login.php/login.php/groupcp.php/faq.php/faq.php/groupcp.php/profile.php?mode=register
   30:       : Jul/10/26 11:39 PM: /psforums/login.php/login.php/faq.php/groupcp.php/groupcp.php/profile.php
   30:       : Jul/10/26 10:23 PM: /psforums/login.php/login.php/faq.php/login.php/groupcp.php/memberlist.php/memberlist.php/login.php
   30:       : Jul/10/26 11:28 PM: /psforums/login.php/login.php/faq.php/groupcp.php/login.php/profile.php
   30:       : Jul/10/26 11:31 PM: /psforums/search.php/login.php/groupcp.php/faq.php
   29:       : Jul/10/26 11:51 PM: /psforums/search.php/memberlist.php/faq.php/index.php
   29:       : Jul/10/26 11:34 PM: /psforums/search.php/search.php/search.php/faq.php
   28:       : Jul/10/26 10:21 PM: /psforums/login.php/login.php/faq.php/login.php/groupcp.php/memberlist.php/profile.php
   11:       : Jul/10/26 10:21 PM:   /psforums/login.php/login.php/faq.php/login.php/groupcp.php/memberlist.php/profile.php?mode=editprofile
   27:       : Jul/10/26 11:57 PM: /psforums/login.php/login.php/faq.php/groupcp.php/index.php
   27:       : Jul/10/26 11:48 PM: /psforums/search.php/faq.php/groupcp.php/index.php
   27:       : Jul/10/26 11:30 PM: /psforums/search.php/memberlist.php/memberlist.php
   27:       : Jul/10/26 10:24 PM: /psforums/login.php/login.php/faq.php/login.php/groupcp.php/memberlist.php/memberlist.php/faq.php
   27:       : Jul/10/26 11:40 PM: /psforums/faq.php/login.php
   27:       : Jul/10/26 11:49 PM: /psforums/search.php/search.php/search.php/login.php
   27:       : Jul/10/26 11:32 PM: /psforums/login.php/login.php/faq.php/groupcp.php/groupcp.php
   27:       : Jul/10/26 11:06 PM: /psforums/login.php/login.php/faq.php/groupcp.php/memberlist.php
   26:       : Jul/10/26 10:24 PM: /psforums/login.php/login.php/faq.php/login.php/groupcp.php/memberlist.php/memberlist.php/index.php
   26:       : Jul/10/26 11:44 PM: /psforums/search.php/faq.php/groupcp.php/search.php
   26:       : Jul/10/26 10:19 PM: /psforums/login.php/login.php/faq.php/groupcp.php/login.php
   26:       : Jul/10/26 10:58 PM: /psforums/search.php/groupcp.php/profile.php
   26:  0.09%: Jul/10/26  3:39 PM: /priv_stats/usage_202302.html
   26:       : Jul/10/26 11:52 PM: /psforums/search.php/login.php/groupcp.php/login.php
   25:       : Jul/10/26 10:23 PM: /psforums/login.php/login.php/faq.php/login.php/groupcp.php/memberlist.php/memberlist.php/memberlist.php
   25:       : Jul/10/26 11:24 PM: /psforums/login.php/login.php/faq.php/groupcp.php/faq.php
   25:       : Jul/10/26 11:50 PM: /psforums/search.php/memberlist.php/login.php
   25:       : Jul/10/26 11:53 PM: /psforums/search.php/search.php/memberlist.php/profile.php
   25:       : Jul/10/26 10:45 PM: /psforums/login.php/login.php/faq.php/faq.php/search.php/profile.php
   25:       : Jul/10/26 11:37 PM: /psforums/search.php/search.php/search.php/index.php
   25:       : Jul/10/26 11:38 PM: /psforums/search.php/faq.php/index.php
   25:       : Jul/10/26 10:50 PM: /psforums/login.php/login.php/faq.php/groupcp.php/privmsg.php
   25:       : Jul/10/26 11:47 PM: /psforums/profile.php/search.php
   24:       : Jul/10/26 11:50 PM: /psforums/login.php/faq.php/groupcp.php
   24:       : Jul/10/26 11:23 PM: /psforums/search.php/login.php/groupcp.php/privmsg.php
   24:       : Jul/10/26 10:03 PM: /psforums/memberlist.php/login.php/profile.php
   24:       : Jul/10/26 10:24 PM: /psforums/login.php/login.php/faq.php/login.php/groupcp.php/memberlist.php/memberlist.php/groupcp.php
   24:       : Jul/10/26 11:50 PM: /psforums/search.php/faq.php/groupcp.php/login.php
   24:  0.10%: Jul/10/26 10:58 PM: /priv_stats/usage_200803.html
   24:       : Jul/10/26 11:56 PM: /psforums/search.php/login.php/profile.php
   24:       : Jul/10/26 11:46 PM: /psforums/faq.php/search.php
   23:       : Jul/10/26  9:37 PM: /psforums/search.php/memberlist.php/index.php
   23:       : Jul/10/26 11:28 PM: /psforums/search.php/search.php/faq.php/profile.php
   22:       : Jul/10/26 11:44 PM: /psforums/login.php/faq.php/search.php
   22:       : Jul/10/26 11:44 PM: /psforums/search.php/memberlist.php/groupcp.php
   22:       : Jul/10/26 10:22 PM: /psforums/search.php/memberlist.php/privmsg.php
   22:       : Jul/10/26 11:56 PM: /psforums/login.php/memberlist.php/profile.php
   22:       : Jul/10/26 10:06 PM: /main.htm
   22:  0.08%: Jul/10/26 12:59 PM: /priv_stats/usage_202504.html
   22:       : Jul/10/26 11:55 PM: /psforums/login.php/login.php/faq.php/login.php/groupcp.php/groupcp.php
   22:       : Jul/10/26 11:35 PM: /psforums/search.php/login.php/groupcp.php/index.php
   22:       : Jul/10/26 11:58 PM: /psforums/search.php/search.php/search.php/memberlist.php
   21:       : Jul/10/26 10:45 PM: /psforums/search.php/faq.php/privmsg.php
   21:       : Jul/10/26 11:31 PM: /psforums/search.php/login.php/groupcp.php/groupcp.php
   21:       : Jul/10/26 11:20 PM: /psforums/search.php/memberlist.php/login.php/groupcp.php
   21:       : Jul/10/26 10:16 PM: /psforums/search.php/memberlist.php/faq.php/privmsg.php
   21:       : Jul/10/26  8:49 PM: /psforums/login.php/faq.php/login.php
   21:       : Jul/10/26 10:23 PM: /psforums/login.php/login.php/faq.php/login.php/groupcp.php/memberlist.php/memberlist.php/privmsg.php
   21:       : Jul/10/26 10:23 PM:   /psforums/login.php/login.php/faq.php/login.php/groupcp.php/memberlist.php/memberlist.php/privmsg.php?folder=inbox
   21:       : Jul/10/26 10:43 PM: /psforums/search.php/login.php/groupcp.php/search.php
   21:       : Jul/10/26 11:56 PM: /psforums/login.php/privmsg.php
   10:       : Jul/10/26 11:56 PM:   /psforums/login.php/privmsg.php?folder=inbox
   21:       : Jul/10/26 11:00 PM: /psforums/search.php/memberlist.php/faq.php/faq.php
   21:       : Jul/10/26  9:19 PM: /psforums/login.php/search.php/search.php/faq.php/profile.php
   21:       : Jul/10/26 10:37 PM: /psforums/
   21:       : Jul/10/26 10:06 PM: /header.html
   20:       : Jul/10/26 11:30 PM: /psforums/login.php/login.php/faq.php/groupcp.php/search.php
   20:       : Jul/10/26 10:28 PM: /psforums/login.php/login.php/faq.php
34572:  4.61%: Jul/11/26 12:00 AM: [not listed: 19,543 files]
(Go To: Top: General Summary: Daily Summary: Hourly Summary: Domain Report: Organization Report: Operating System Report: Status Code Report: File Size Report: File Type Report: Directory Report: Request Report)

